Timeline
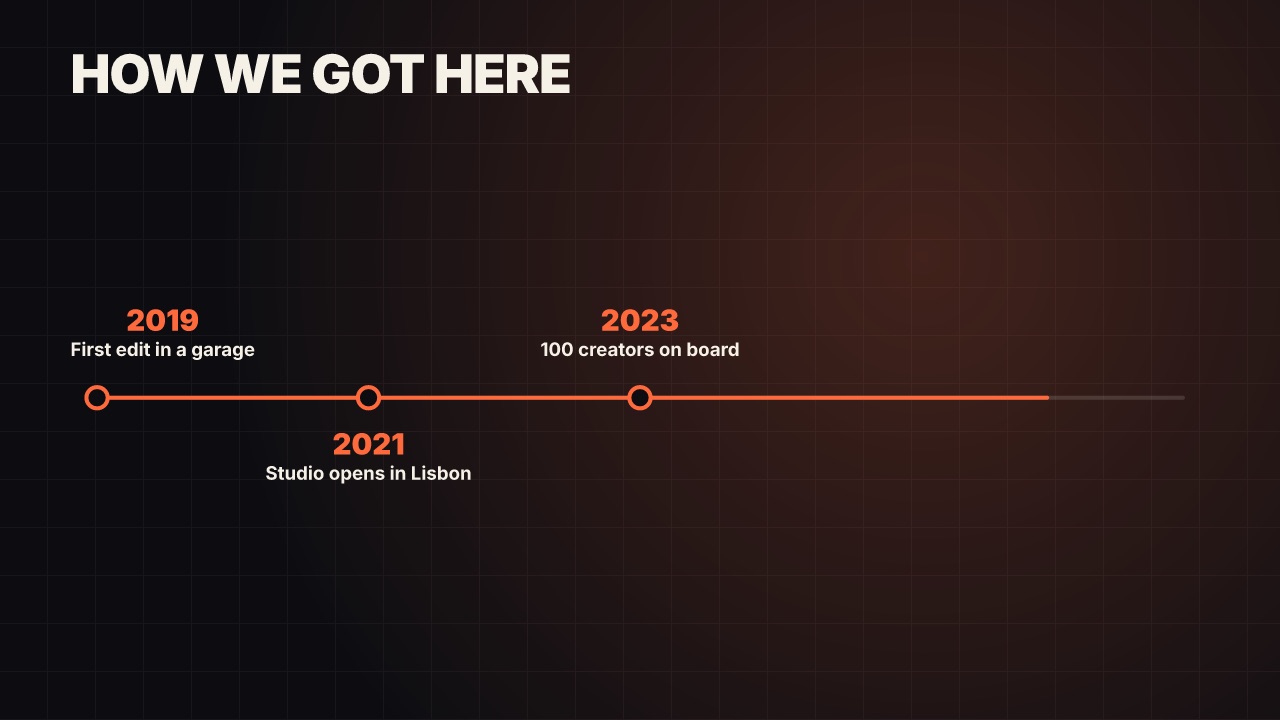
Milestones along a line that draws itself: each date's dot pops as the line reaches it and its words rise beside it.
data/timeline- Data
- list
- Full frame
- 7 s (3–40 s)
Render it
npx volito render data/timeline --prop title="How we got here" --out timeline.movThat writes ProRes 4444. The same item in another shape, brand or format:
volito render data/timeline --aspect 9:16 --style cobalt --out timeline-9x16.mov
volito render data/timeline --format mp4 --out timeline.mp4
volito still data/timeline --t 3.5 --out timeline.png
volito info data/timeline     # every prop and part
volito add data/timeline # copy its source into ./motion to editFrom Node:
import { findItem, renderVideo } from "volito";

await renderVideo(findItem("data/timeline"), { props: { title: "How we got here" }, out: "timeline.mov" });Or ask an agent with the MCP server connected: “Render the Volito timeline (data/timeline) in 9:16, in our brand.”
Props
Set each with --prop name=value, or all at once with --props and a JSON object.
| Prop | Type | Default | Takes |
|---|---|---|---|
title | text | How we got here | ≤ 50 chars |
rowsMilestones (When: what) | list | {"when":"2019","what":"First edit in a garage"}; {"when":"2021","what":"Studio opens in Lisbon"}; {"when":"2023","what":"100 creators on board"}; {"when":"2025","what":"The AI editor ships"}; {"when":"2026","what":"Volito goes open"} | — |
Parts
Each part takes any move, ease or idle: --motion ground.in=pop.
| Part | What it is |
|---|---|
ground | the ground |
title | the heading |
line | the line |
dots | the dots |
labels | the dates and words |
More in Data
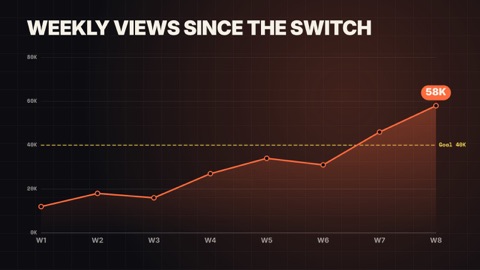
Line chart
A line draws on through its points over a soft area, each point popping as the line reaches it, the last value called out, against an optional target.
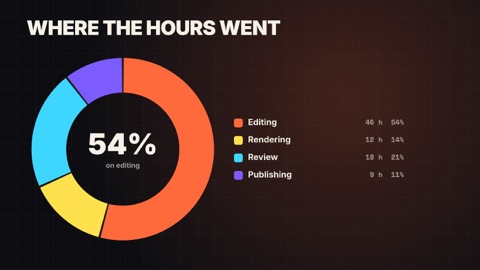
Donut chart
Segments sweep round a ring one after another, the centre counts up to the total (or the first share), and a legend lists each part.
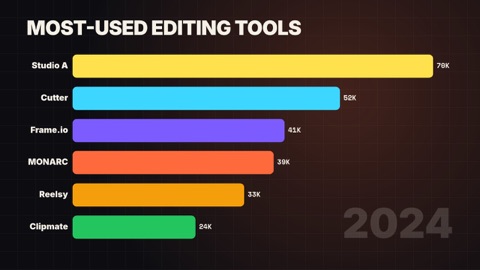
Bar chart race
Ranked bars grow and overtake each other as the periods advance; the axis rescales and the period counts up in the corner.
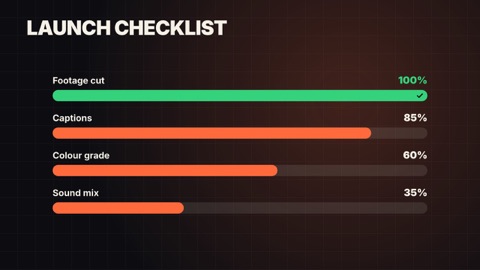
Goal meters
Rows of capsule meters fill to their share of a goal, each with its label and a percentage counting up.
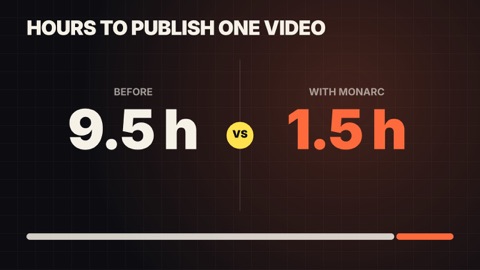
Versus
Two sides face off: a label and a big number counting up on each, a VS badge popping between them and a split bar settling to their ratio.
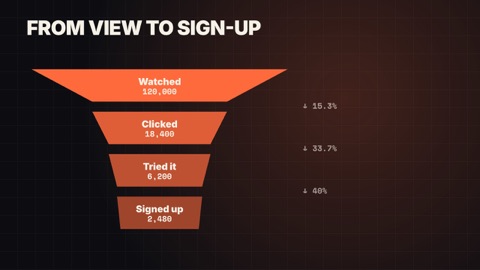
Funnel
Stages stack from widest to narrowest, each dropping in with its count, and the share that carries on to the next stage between them.