Activity heatmap
A calendar heatmap: weeks across, days down, each day shaded by how busy it was, filling in week by week under a total that counts up, with a Less–More key.
data/heatmap- Data
- chart
- Full frame
- 6 s (3–30 s)
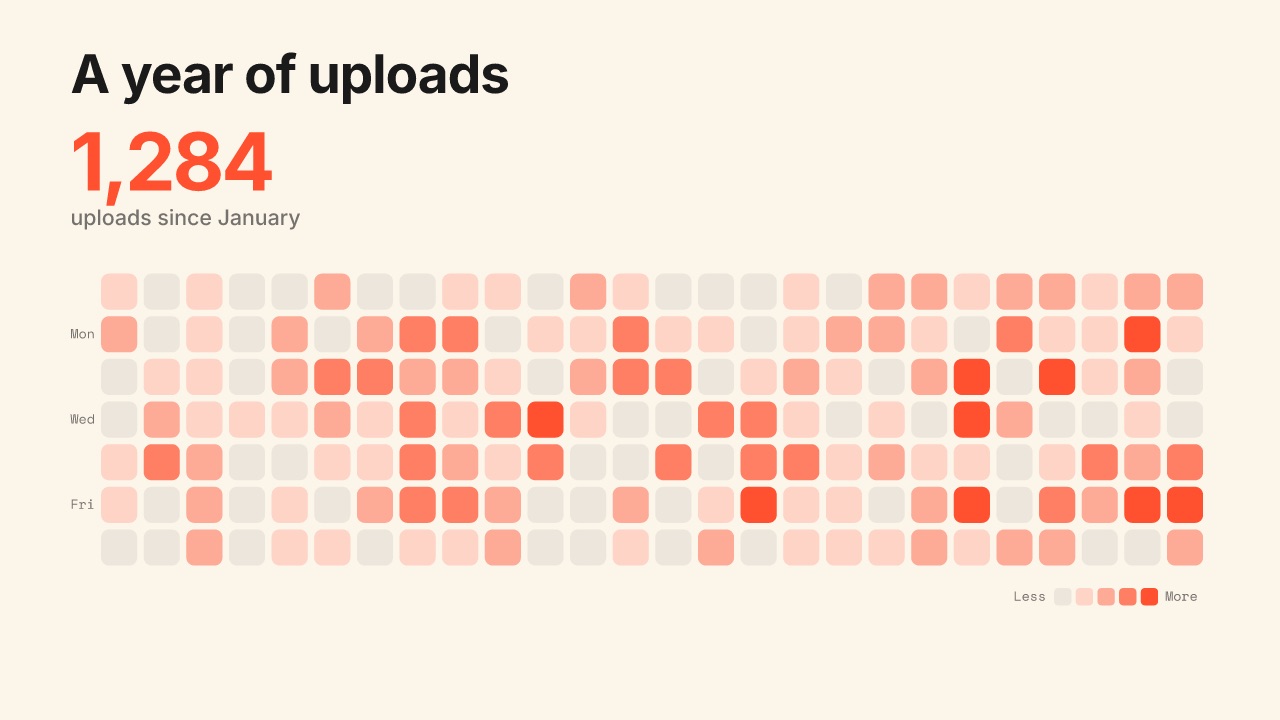
npx volito render data/heatmap --style cream --out heatmap.movRender it
npx volito render data/heatmap --prop title="A year of uploads" --prop label="uploads since January" --out heatmap.movThat writes ProRes 4444. The same item in another shape, brand or format:
volito render data/heatmap --aspect 9:16 --style cobalt --out heatmap-9x16.mov
volito render data/heatmap --format mp4 --out heatmap.mp4
volito still data/heatmap --t 3 --out heatmap.png
volito info data/heatmap     # every prop and part
volito add data/heatmap # copy its source into ./motion to editFrom Node:
import { findItem, renderVideo } from "volito";

await renderVideo(findItem("data/heatmap"), { props: { title: "A year of uploads", label: "uploads since January" }, out: "heatmap.mov" });Or ask an agent with the MCP server connected: “Render the Volito activity heatmap (data/heatmap) in 9:16, in our brand.”
Props
Set each with --prop name=value, or all at once with --props and a JSON object.
| Prop | Type | Default | Takes |
|---|---|---|---|
title | text | A year of uploads | ≤ 50 chars |
total | number | 1284 | 0 – 1000000000 |
labelTotal label | text | uploads since January | ≤ 60 chars |
weeks | number | 26 | 4 – 53 |
seedPattern seed | number | 3 | 1 – 999 |
Parts
Each part takes any move, ease or idle: --motion ground.in=pop.
| Part | What it is |
|---|---|
ground | the ground |
title | the heading |
total | the total and its label |
cells | the day cells |
key | the day names and key |
More in Data
Line chart
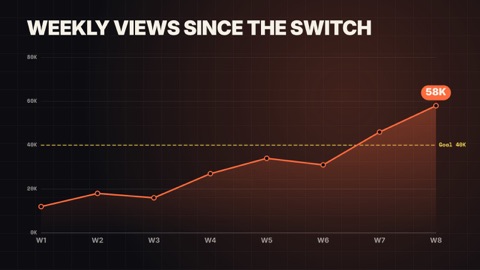
A line draws on through its points over a soft area, each point popping as the line reaches it, the last value called out, against an optional target.
Donut chart
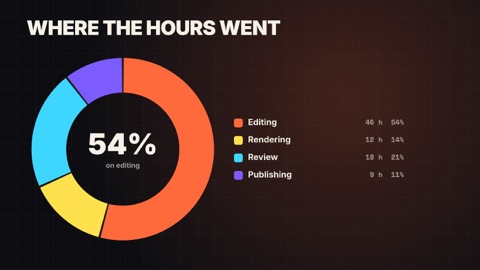
Segments sweep round a ring one after another, the centre counts up to the total (or the first share), and a legend lists each part.
Bar chart race
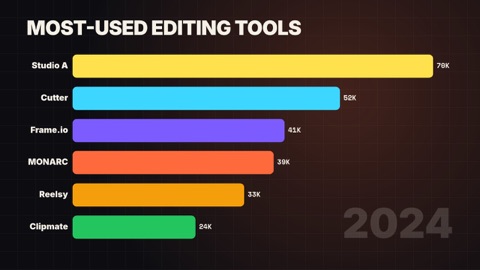
Ranked bars grow and overtake each other as the periods advance; the axis rescales and the period counts up in the corner.
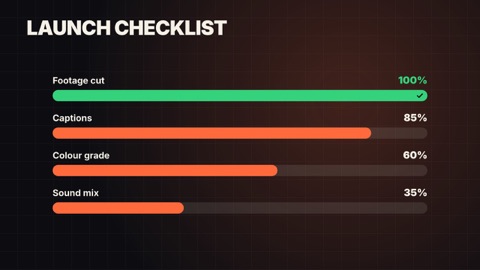
Goal meters
Rows of capsule meters fill to their share of a goal, each with its label and a percentage counting up.
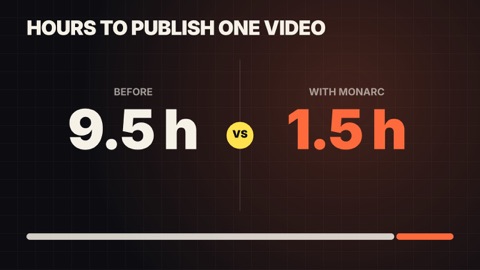
Versus
Two sides face off: a label and a big number counting up on each, a VS badge popping between them and a split bar settling to their ratio.
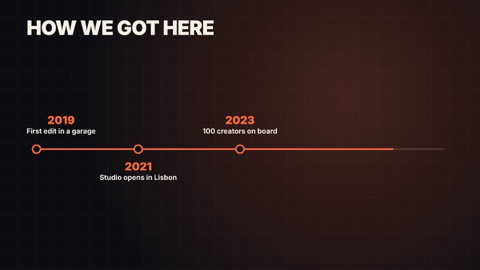
Timeline
Milestones along a line that draws itself: each date's dot pops as the line reaches it and its words rise beside it.